


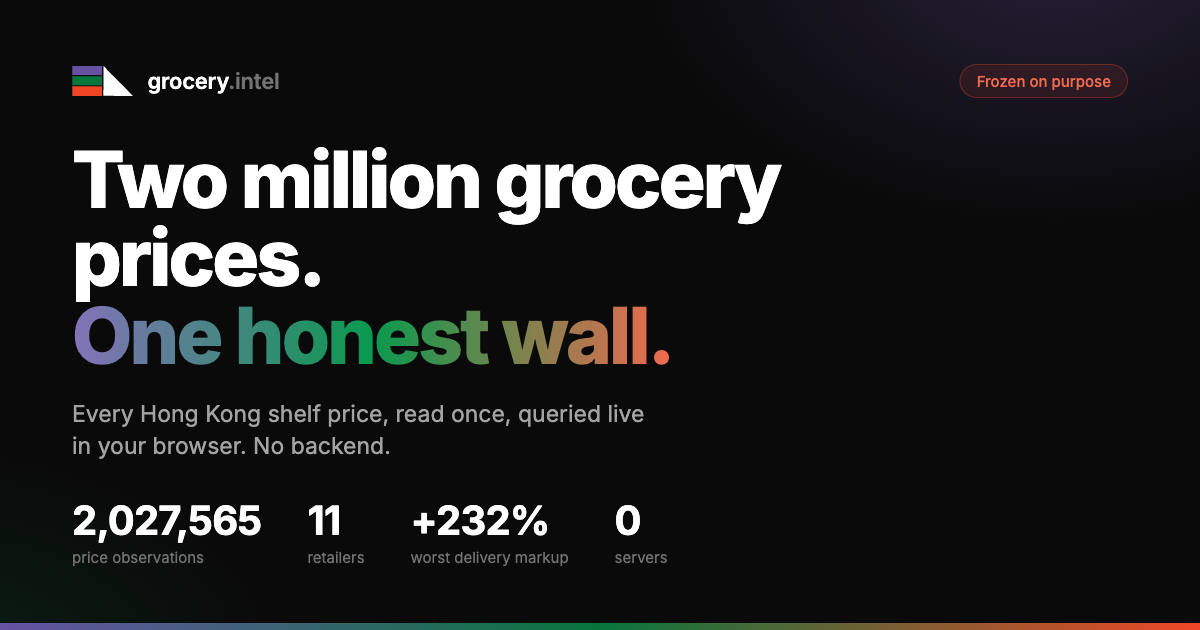
A Dr. Groot scalp treatment costs HK$59.90 if you walk into the store and pick it off the shelf. Order it through foodpanda and the same product is HK$199. That is a 232% markup. Not a pricing error. Not a limited-time surge. A permanent, silent policy, sitting in plain sight inside the retailer's own product catalog.
I found 2,027,565 of these comparisons. Then I stopped.
This is the story of what I found, how the pipeline worked, where it hit a wall that was genuinely worth respecting, and why the most interesting part of the whole project ended up being a WebAssembly trick that lets you run SQL against two million rows inside a browser tab with no server anywhere in the loop.
The starting question was domestic
My wife noticed it first. Hong Kong grocery shopping, if you actually want to eat well, requires routing across multiple retailers. city'super for the good cheese. Wellcome for daily staples. HKTVmall for things the other two don't carry. You can spend an hour just managing which app to order from.
I noticed a separate thing: the foodpanda price for a product was often not the same as the price on the chain's own website. The gap felt systematic. I wanted to know if it was.
That question is what one weekend became.
What got built
The pipeline reads publicly listed catalog and price data across 11 Hong Kong retail sources: the foodpanda delivery overlay sitting across the top of several major chains, plus the chains' own e-commerce sites directly. ParknShop, Wellcome, Watsons, Mannings, Marketplace by Jasons, city'super, AEON, Marks and Spencer, HKTVmall, and Bestmart 360. These are public product pages, prices any shopper sees before logging in, no different from what you'd look at on your phone in the supermarket aisle.
Each source gets one adapter. All adapters feed a shared normalized schema. The final snapshot as of 2026-05-26:
| Source | Rows | Share |
|---|---|---|
| foodpanda delivery overlay | 1,929,607 | 95.2% |
| Chain-direct e-commerce | 89,329 | 4.4% |
| HKTVmall marketplace | 8,629 | 0.4% |
| Total | 2,027,565 |
- 1,147 stores indexed
- 11 sources
- 156,433 product families identified
- 110,508 distinct barcodes
The raw data, uncompressed, runs about 10 GB of JSON. The normalized version collapses to a 290 MB Parquet file using columnar storage. Roughly 35x smaller, because most columns repeat the same handful of category strings, retailer names, and unit types across millions of rows. Columnar compression eats repetition.
The local LLM part, which is the part I actually care about
Category strings from real retailers are a mess. Wellcome has a category called "3:15 PM Tea Break." foodpanda has one called "$10 Flash Sale." There is a "7-SELECT Dim Sum" bucket. There are categories that are promotion names, categories that are time-limited events frozen in the taxonomy, categories that describe the shelf location in a store that no longer has that shelf layout.
None of that maps cleanly to a useful taxonomy like "Beverages" or "Personal Care." Getting from the merchant's string to something comparable across chains requires classification.
Paying an API per row at two million rows is expensive and leaks product data to a third-party server. I did neither.
Instead: a local model, qwen2.5:7b running on Ollama on my Mac, classified each distinct never-seen category string exactly once into a durable JSON map. There were 632 of these strings. The model ran 632 times total, not two million times. Once a string was classified, every future row matching that string reads from the lookup table. No model call. No latency. No API bill. No data leaving the machine.
The result: uncategorized rows dropped from 58,700 down to 15,900. That 0.8% residual is mostly genuine non-grocery, AEON durables, a few things that don't have a clean home in any taxonomy.
A second local model handled a different problem. When barcodes were missing, I needed to match product names across languages. A Chinese product name and its English counterpart are the same product, but string-matching fails entirely. bge-m3 embeddings, also running on Ollama, generated semantic vectors for product names and found cross-language matches where the barcode join couldn't. Again: local, private, free beyond electricity.
This is the thesis of the whole project compressed into one paragraph: a two-million-row normalization job, multilingual, done privately, on a laptop, for the price of running a Mac mini for a few hours. This is what "serious data work in 2026" means. You don't need a data warehouse team. You need to understand which model to use for which job and how to cache the result so the model only runs once.
What the data actually says
The cleanest finding is the delivery markup comparison: same retailer, same product ID, chain website price versus foodpanda price. No fuzzy matching. The retailer's own catalog on two channels.
The extreme cases first, because they're concrete:
- Dr. Groot scalp treatment: HK$59.90 direct, HK$199 on delivery. +232%
- Haidilao hot-pot base: HK$17.50 direct, HK$50 on delivery. +186%
- Calbee chips: HK$8 direct, HK$22 on delivery. +175%
These aren't luxury outliers. Calbee chips. The gap is not explained by service fees (those are itemized separately in the checkout). These are the product prices themselves, before any delivery fee is added.
The chain-level picture:
| Chain | Average markup vs direct | Top decile markup |
|---|---|---|
| city'super | ~+20% (near-flat across catalog) | ~+22% |
| Wellcome | +13.2% average | +50% |
| Mannings | +5.1% average | +33% |
| M&S | near parity | ~+2% |
M&S treats foodpanda as an identical channel to its own site. 97% of matched products price at parity. city'super adds a near-flat 20% to almost everything. Wellcome and Mannings show what pricing researchers call a Hi-Lo pattern: frequent deep promotions on some items, aggressive markups on others. The average looks reasonable; the distribution is wide.
Who runs the most sales? Marketplace by Jasons leads with 54% of their catalog on promotion at any given time. Wellcome runs 48%, Mannings 22%, ParknShop 21%, AEON 6%. AEON's low promo rate is consistent with their positioning: everyday low price, not sale-event theater.
The wall
Here is the comparison I wanted to make and couldn't, not reliably: the same product, same package size, same manufacturer, at ParknShop versus Wellcome versus city'super. The "which chain is actually cheaper for my weekly basket" question.
That comparison needs a shared identifier. The obvious candidate is the barcode.
Watsons does not publish barcodes in their public product listings. ParknShop doesn't either. They use internal inventory identifiers. AEON uses codes that don't match the GS1 standard. M&S uses 8-digit codes; foodpanda's catalog carries 13-digit ones for the same products, and the mapping isn't 1-to-1.
So I fell back to name-based matching, building what I call family_id: a cluster of product listings that appear to be the same item across sources based on normalized name similarity. The pipeline found 14,325 families appearing at two or more chains. That sounds like progress.
It isn't. Strip out the corporate structure and almost all of those families are the same parent company wearing different hats. Wellcome, Mannings, and Marketplace by Jasons are all DFI Retail Group. ParknShop and Watsons are both A.S. Watson. A product that appears in both Wellcome and Mannings is not a cross-company price comparison. It is one company's internal pricing policy visible through two storefronts.
After filtering for genuinely cross-company matches at three or more retailers with different parent companies: approximately 131 product families. That is not enough to build a credible basket comparison on.
To go further you'd need the loyalty program price feeds. The yuu app (DFI) and Moneyback (A.S. Watson) carry member prices that diverge from the public catalog in ways that actually matter for price comparison. Those are a different scope, a different access model, and a much larger project.
So I chose to stop here. Not because the data was bad. Because I had answered the question I actually asked, hit the limit of what public catalog data can rigorously support, and recognized that the next step was a different project requiring different infrastructure. Knowing where your dataset's claims end is the skill. Pushing past it produces confident-sounding nonsense.
The pipeline is deprecated. The data stays up.
The browser-as-database trick
The part of this project I'm most interested in showing off has nothing to do with groceries.
10 GB of raw JSON, normalized to 290 MB of Parquet. How do you let people explore that without spinning up a server, paying for a database, or asking anyone to download 290 MB?
The 2026 answer: DuckDB compiled to WebAssembly.
DuckDB-WASM is a full analytical SQL engine, the same one data engineers run on their laptops against multi-gigabyte files, compiled to a ~3.5 MB WebAssembly binary. It runs entirely inside your browser tab. No server. No API. No backend process. The database is the browser.
The Parquet file lives on Cloudflare R2 object storage. The WASM engine reads it using HTTP range requests: instead of downloading the whole 290 MB file, it requests only the specific byte ranges it needs to answer each query. A filter on a single retailer might pull 2 MB. A full table scan of all 2,027,565 rows might pull more. But the user controls that, because the query is SQL and the cost is visible.
The whole stack is static files on Cloudflare Pages plus one Parquet file on R2. No running instances. No monthly server bill. No database to patch. The "infrastructure" is a CDN that I was already paying nothing for.
flowchart LR
    A["Browser tab"] -- "loads once" --> B["DuckDB-WASM (~3.5 MB)"]
    B -- "HTTP range requests" --> C["Parquet file on Cloudflare R2"]
    C -- "only the bytes the query needs" --> B
    B -- "query results" --> D["Dashboard UI"]
    E["Cloudflare Pages (static)"] -- "serves" --> A
The live dashboard is at grocery.egor.lol. The firehose view shows the raw price observation stream: every product, every source, every price, filterable in real time. Run your own SQL if you want. The full 2,027,565-row dataset is there, no account required, processing in your browser.
That is the portfolio point, separate from anything about groceries. You can ship a data product with no running infrastructure, no operational overhead, and no marginal cost per query. A solo builder in 2026 can do what used to require a data platform team. The grocery project was the excuse; the stack is the demonstration.
What I answered and what I didn't
The original questions both got answered.
Does the same product cost more on foodpanda than on the chain's own site? Yes, systematically, and the gap varies wildly by chain. city'super makes it a policy. M&S makes it a non-issue. Wellcome is unpredictable in the best and worst ways.
Can you compare prices across Hong Kong's major chains for a realistic weekly basket? Not with public catalog data alone. The barcode gap is real. The corporate consolidation makes name-matching misleading. The honest answer is no, not yet, and probably not without the loyalty data feeds.
The project ran long enough to answer both. The first question clearly, the second clearly enough to know the answer requires something the data doesn't have. That is a complete result. Not a failure. Not a launch. A thing that got built, found what it could find, and knew when to stop.
If you work at a CPG brand and this kind of competitive shelf data matters to your pricing team, I'm curious what you'd use it for. Not selling anything. The dataset is public. My email is on this site.
And if you're building something that needs to expose a large dataset in a browser with no backend: look at the DuckDB-WASM path seriously. The grocery dashboard is a working example. The stack is simpler than you think.